O. Paliy and B. Foy
Mathematical modeling of 16S ribosomal DNA amplification reveals optimal conditions for the interrogation of complex microbial communities with phylogenetic microarrays (2011) Bioinformatics, 27(15): 2134-40.
Full text (pdf)
Supplementary material:
- Supplementary figure S1 (png): Agarose gel electrophoresis of gDNA samples amplified with different number of PCR cycles
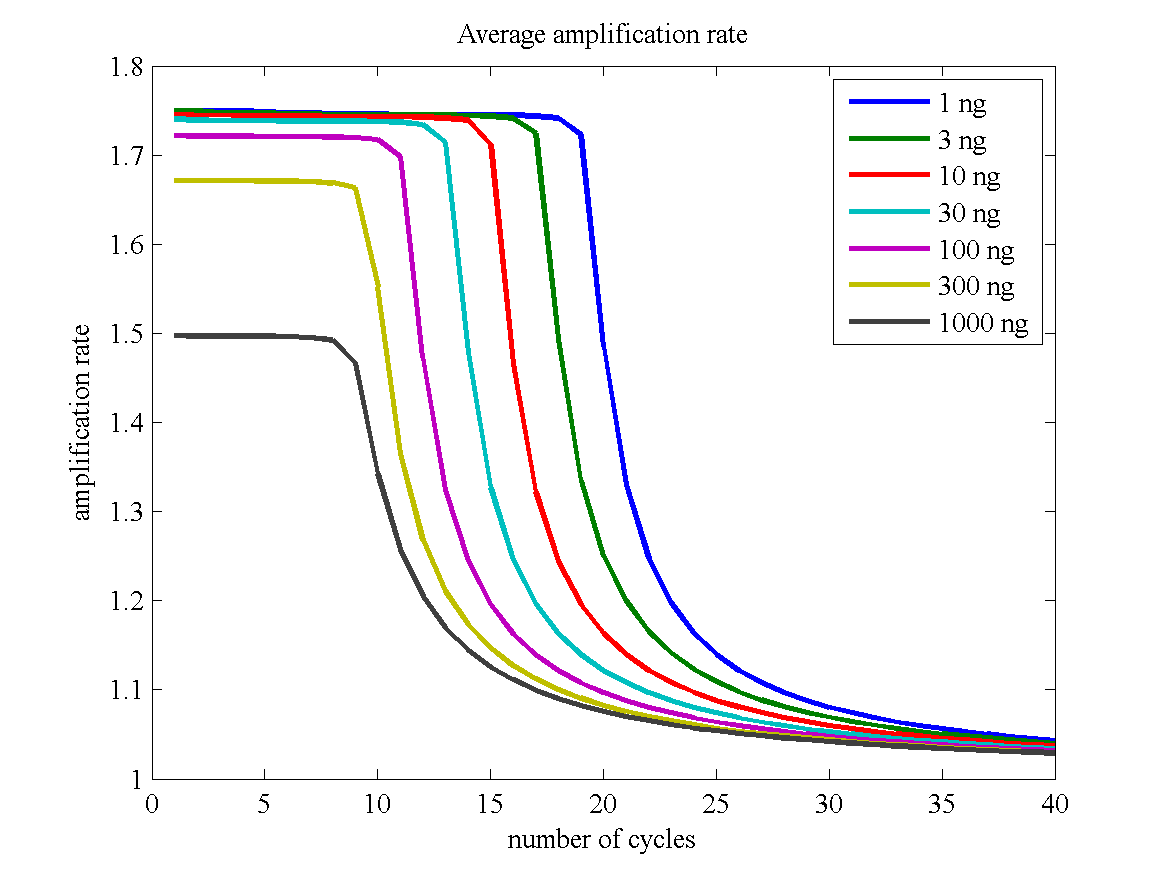
- Supplementary figure S2 (png): Simulation results - average sample amplification rate vs PCR cycle number
- Supplementary figure S3 (png): Simulation results - fraction of 16S rDNA in amplified sample vs PCR cycle number
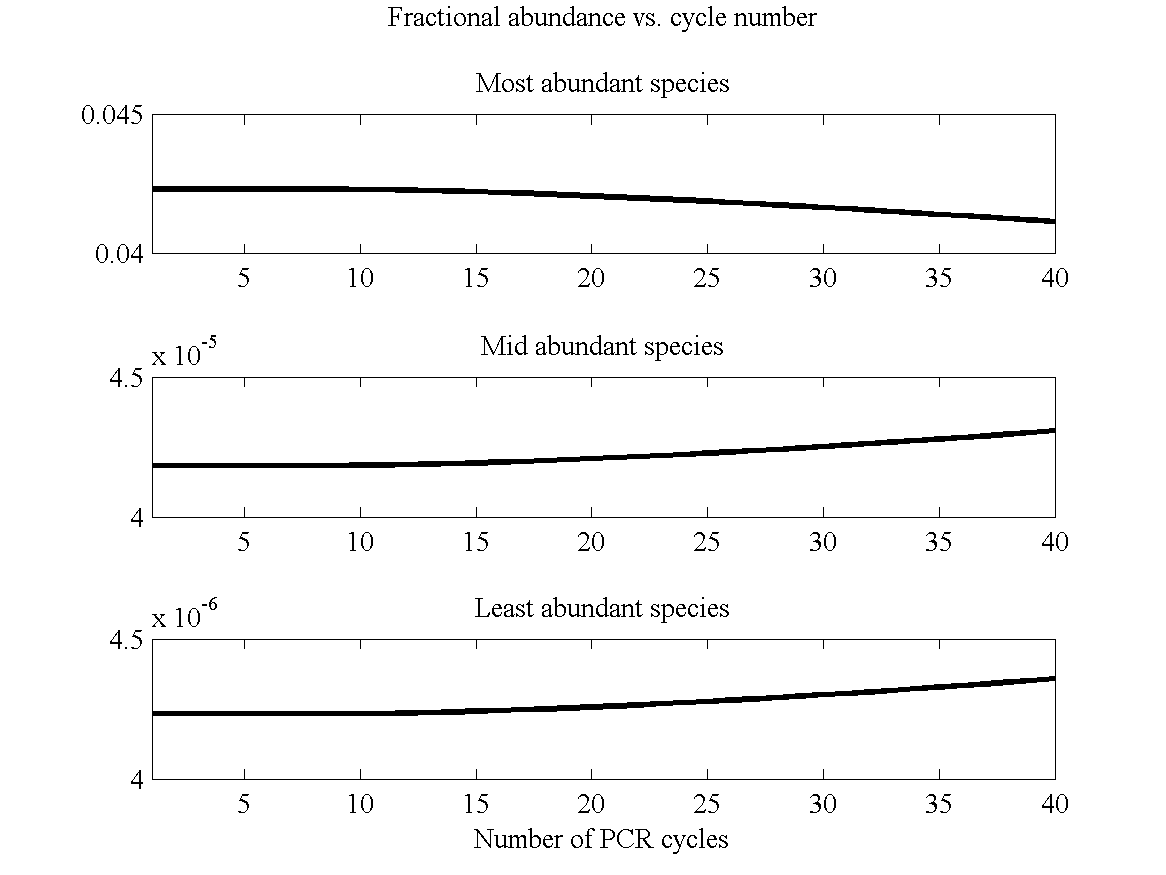
- Supplementary figure S4 (png): Simulation results - deviation of relative 16S rDNA abundances with PCR cycle number [graphs are shown for most abundant gDNA species in the original sample {rank 1}, mid-abundant {rank 200}, and least abundant {rank 400}]
- Supplementary figure S5 (png): Simulation results - yield of PCR reaction as a function of PCR cycle number and amount of starting gDNA [no loss due to PCR reaction purification is assumed]
- Supplementary figure S6 (png): Simulation results - number of PCR-amplified samples needed to becombined to obtain 1500 bp microarray load [we assume 50% loss of DNA during PCR purification]
- Supplementary table S1 (pdf): Comparison of simulated and experimental results
- Detailed model description (pdf)
- Matlab files used to run simulation (zip)
|